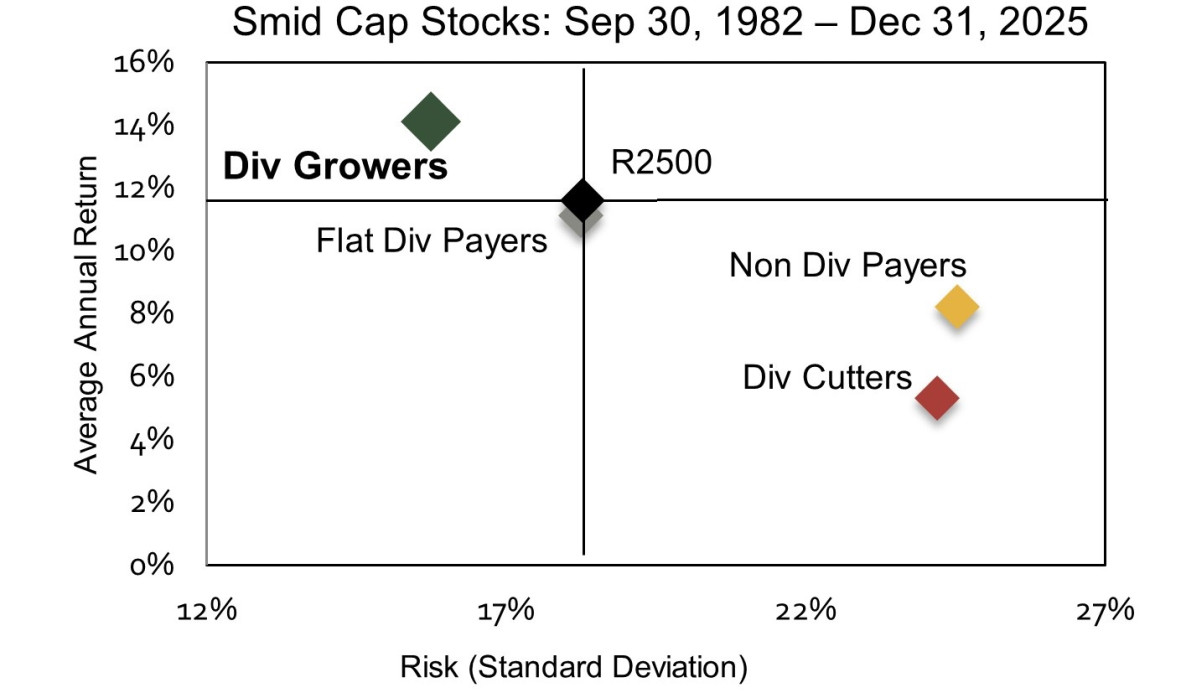
Copyright 2025 Ned Davis Research, Inc. Further distribution prohibited without prior permission. All Rights Reserved. The information presented is intended to illustrate the performance of Smid Cap stocks according to their dividend policy. Returns shown include dividends reinvested. This is not the performance of any strategy overseen by Copeland and there is no guarantee that investors will experience the type of performance reflected in the information presented. Strategies managed by Copeland’s investment team are subject to transaction costs, management fees, trading fees or other expenses not represented in the information presented. There is no guarantee that companies will declare dividends or, if declare, that they will remain at current levels or increase over time. As of 12/31/2014, NDR updated its methodology to incorporate liquidity requirements to improve accuracy. DIVIDEND GROWERS included stocks that raised their existing dividend or initiated a new dividend during the previous 12 months. FLAT DIVIDEND PAYERS included stocks that pay a dividend but have not raised or lowered their existing dividend during the previous 12 months. NON DIVIDEND PAYERS included stocks that have not paid a dividend during the previous 12 months. DIVIDEND CUTTERS included stocks that lowered their existing dividend or eliminate their dividend during the previous 12 months.
Index Disclosures – You cannot invest directly in an Index. The portfolio characteristics of the indexes may differ from other providers due to the source of the data and differences in calculation methodology. Historical analytics are not indicative of future results.
The Russell 2500® Index is comprised of the bottom 2500 companies in the Russell 3000 Index. The Russell 3000® Index measures the performance of the 3000 largest U.S. companies based on total market capitalization, which represents approximately 98% of the investable U.S. equity market.
Standard deviation is a measure of the variability of returns-the higher the standard deviation, the greater the range of performance (i.e., volatility).
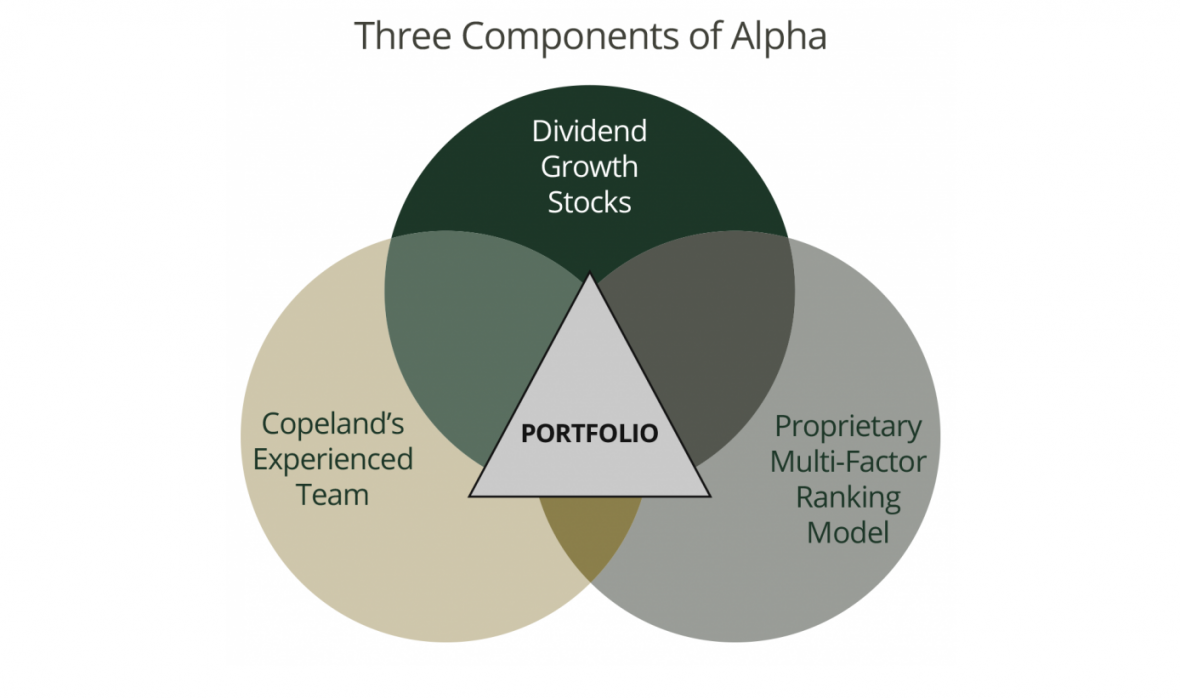
Alpha is a measure of the difference between actual returns and expected performance, given the level of risk as measured by beta, where beta measures sensitivity to index movements.
What are the Risks?
Mutual Funds involve risk including possible loss of principal. The Fund may invest in MLP's. Holders of MLP units have limited control and voting rights on matters affecting the partnership. In addition, there are certain tax risks associated with an investment in MLP units and conflict of interest exist between common unit holders and the general partner, including those arising from incentive distribution payments. The Fund may invest in REIT's. A REIT's performance depends on the type and locations of the rental properties it owns and on how well it manages those properties. Real estate values rise and fall in response to a variety of factors, including local, regional, and national economic conditions, interest rates, and tax considerations. The adviser's judgments about the return tracking characteristics of securities may prove incorrect and may not produce the desired results. The Fund may invest in small and medium capitalization companies and the value of these company securities may be subject to more abrupt or erratic marketing movements than those of larger, more established companies or the market averages in general. A higher portfolio turnover will result in higher transactional and brokerage costs.